How drone visuals reveal project delays and issues on site
@aerialprogress
Spotting problems before they grow
Every construction or infrastructure project relies on accurate progress data. When a delay or quality issue goes unnoticed for days or weeks, the cost to fix it multiplies. Drone-based site capture gives project teams a way to compare what was planned against what actually exists on the ground, and the visuals from each flight can show problems that ground-level inspections miss.
The key is regular, systematic capture of aerial imagery. A single set of drone photos tells you something about the site on that flight date. But the real value comes from comparing multiple captures over time. This is where a structured approach to site capture comparison becomes a practical tool for keeping projects on schedule and within budget.
What drone visuals show that ground checks miss
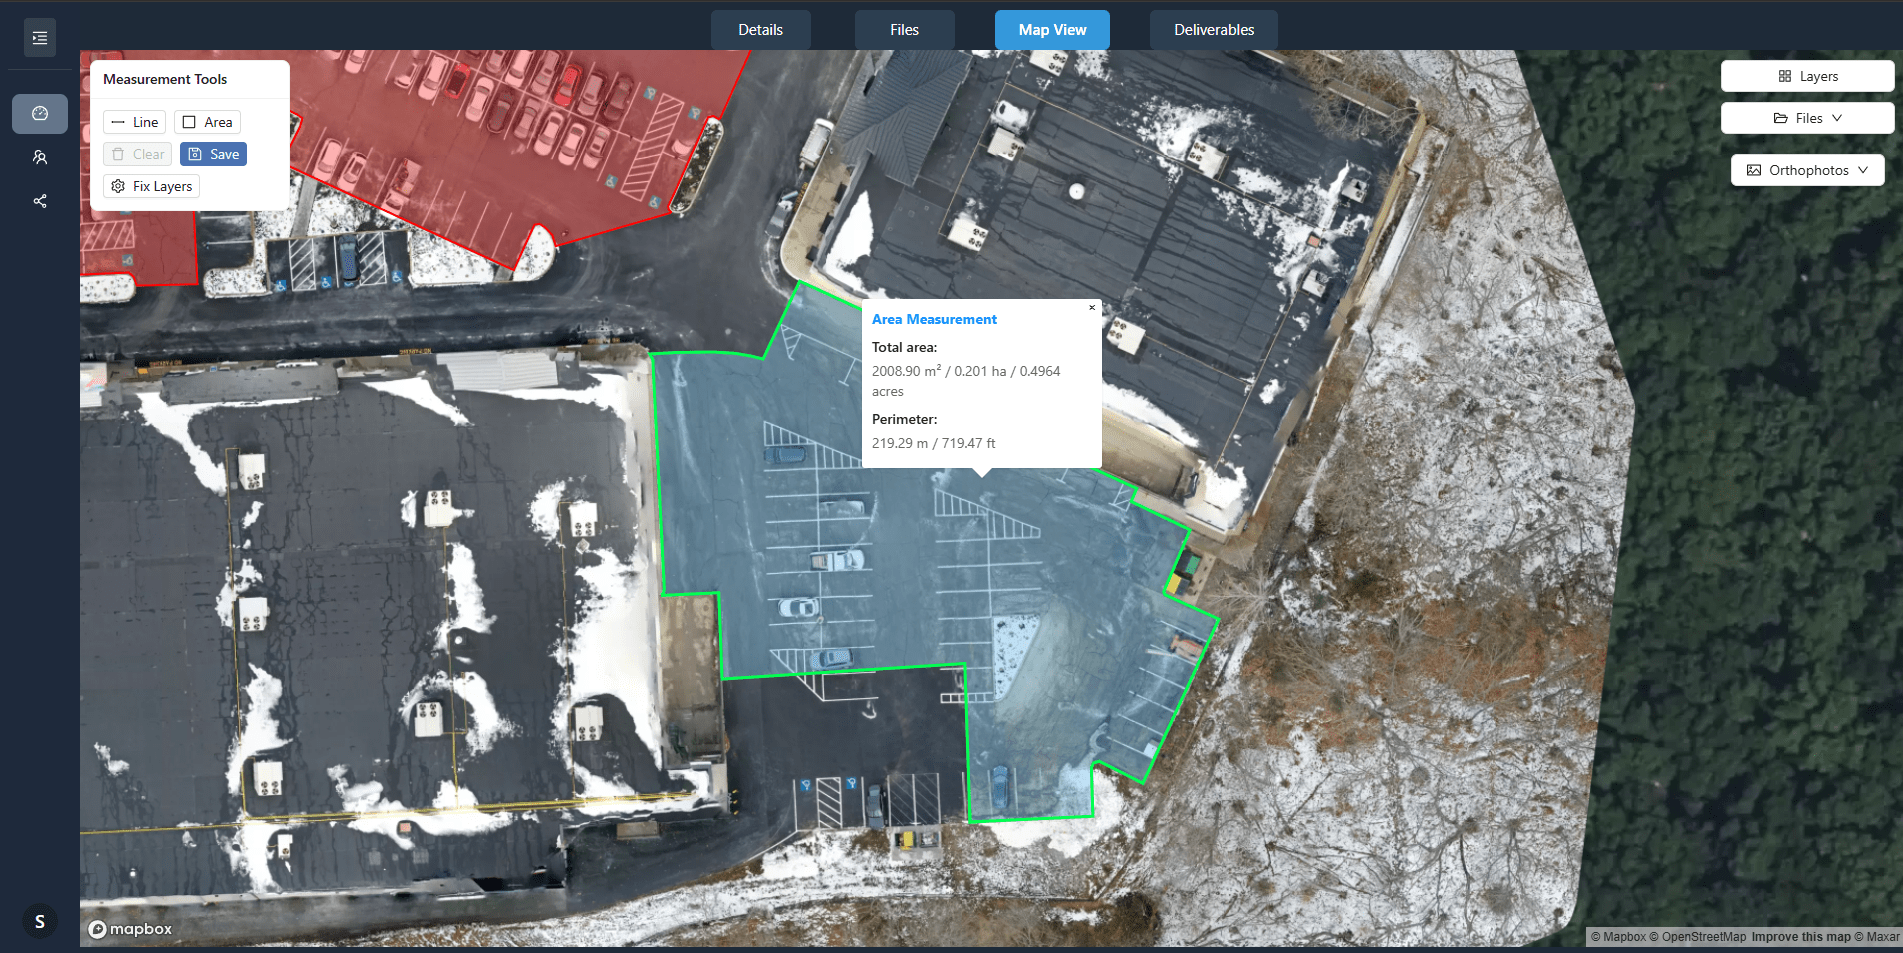
A standard walk-around inspection sees the site from eye level. That angle hides many things: a sag in a roof membrane, a low spot in a graded area where water will pond, a stack of materials that is blocking a planned access route. A drone image taken from directly above removes those blind spots. Orthomosaic maps stitch hundreds of overlapping photos into a single, geometrically correct image of the entire site. On a large construction site, an orthomosaic can reveal at a glance whether earthworks are following the graded design, whether concrete pours are on schedule across multiple slabs, and whether laydown areas are becoming congested.
Beyond the orthomosaic, oblique drone photos taken from angles around the site show vertical elements: walls, crane positions, formwork, scaffolding. These images help project engineers verify that vertical construction matches the elevation drawings. They also catch safety issues such as unsecured guardrails or improperly braced temporary structures. By reviewing both nadir and oblique captures from the same flight date, a team gets a complete picture of site status without leaving the office.
Change detection from one flight to the next
Comparing two sets of drone visuals taken days or weeks apart is the core of progress monitoring. The human eye is good at spotting differences when images are placed side by side, but software can automate much of the work. A platform that layers current orthomosaics over previous ones, or that overlays a design model on a current capture, highlights exactly where work is ahead, behind, or off-spec.
Typical changes that show up clearly in a site capture comparison include:
- New foundations, walls, or structural elements that should have appeared but have not.
- Earthmoving volumes that are trending under or over the planned cut-and-fill quantities.
- Utility trenching that is not progressing along the planned route.
- Stockpile sizes that are growing instead of shrinking, indicating a material supply problem.
- Road or pavement surfaces where cracking or settlement appears between flights.
Each of these findings can trigger a discussion with the contractor or subcontractor before the delay becomes critical. The visual evidence is objective and date-stamped, so there is no argument about whether a problem existed on a given day.
Using site annotation to flag issues
Drone visuals become even more useful when project teams can mark them up directly. Site annotation tools let a project manager draw a circle around a suspect area, add a note, and share that annotated image with the team. For example, if a comparison shows that a retaining wall has not been started two weeks after the schedule said it should be, a simple annotation on the orthomosaic communicates the exact location and the concern. The same annotation can track whether the issue is resolved on the next flight date.
Annotations also help document decisions. When a change order is approved, marking the affected area on a drone image creates a permanent record of the site condition before and after the change. That record protects both the owner and the contractor if a dispute arises later.
Project timeline alignment with aerial data
A project schedule is a set of promises about when work will happen. Drone visuals test those promises against reality. If the schedule says that steel erection should be complete by a certain date and the orthomosaic shows only a few columns in place, the team knows immediately that the timeline is at risk. They can then decide: accelerate the steel contractor, adjust the sequence of following trades, or negotiate a schedule extension while there is still time to manage the impact.
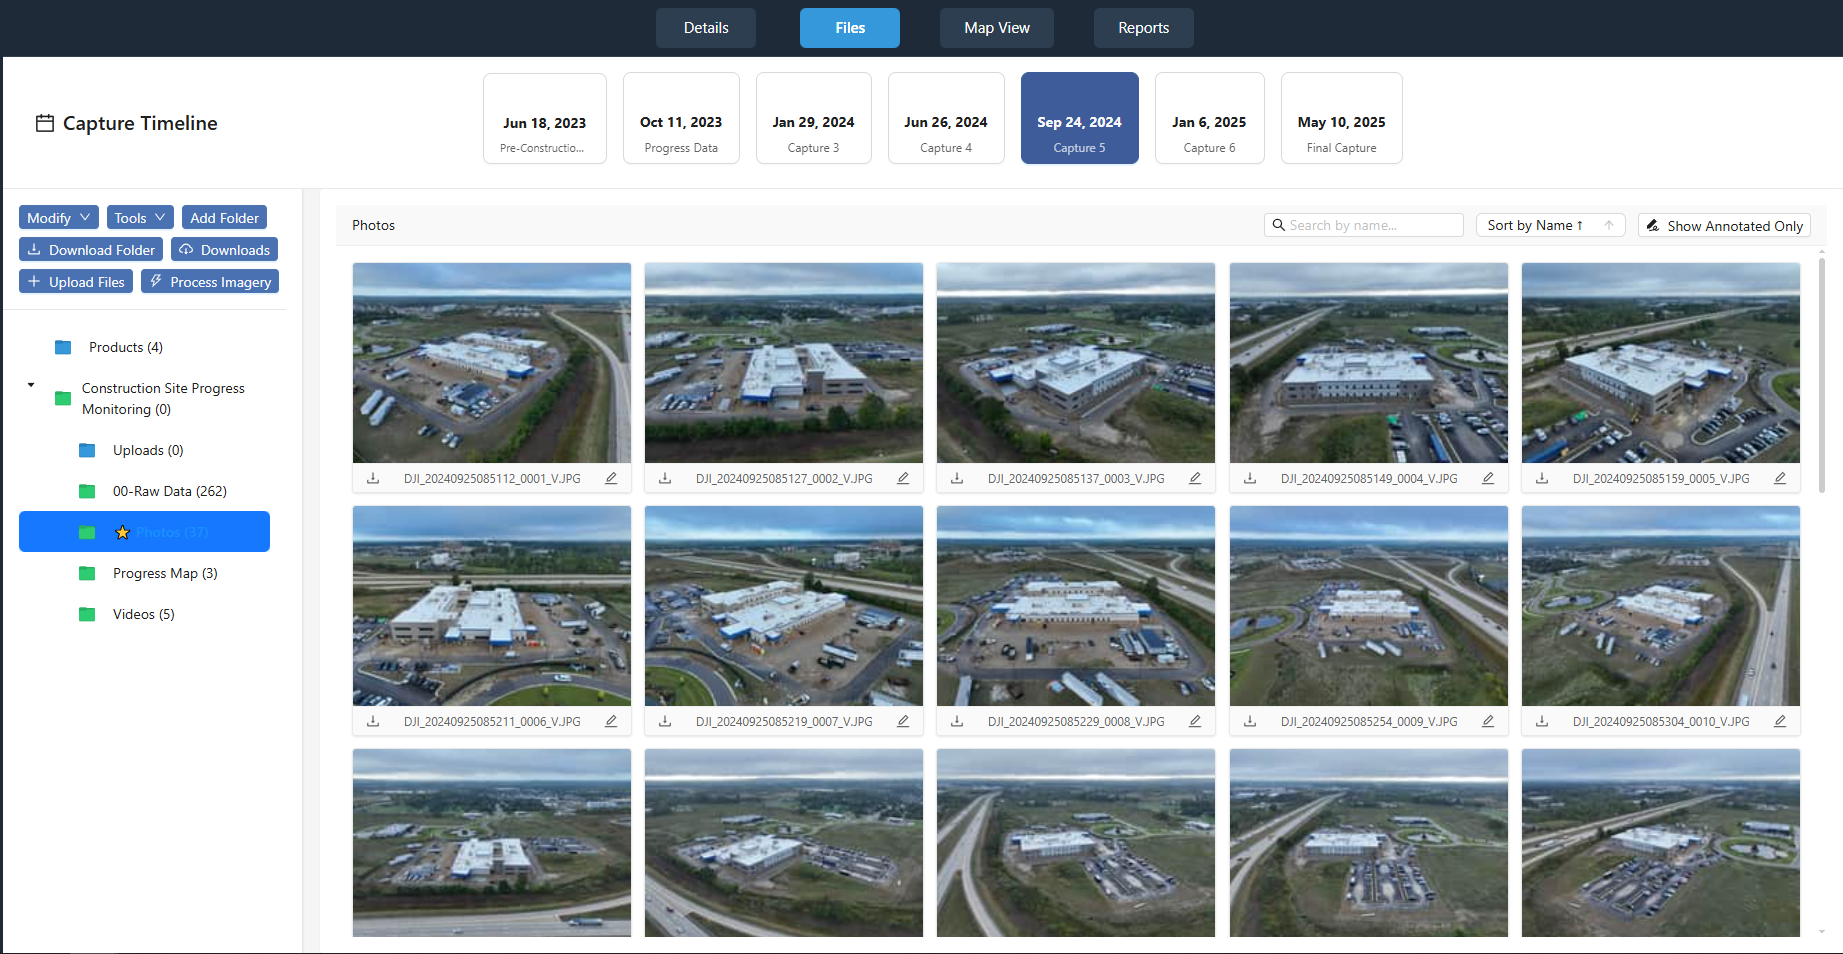
This kind of data-driven decision making requires consistent capture intervals. Ideally, a site is flown on the same day each week, at the same time of day to keep lighting consistent. That consistency makes the site capture comparison reliable. When weather or other factors force a change in flight date, the team should note the gap so they can interpret the comparison correctly.
Practical workflow for capturing and comparing
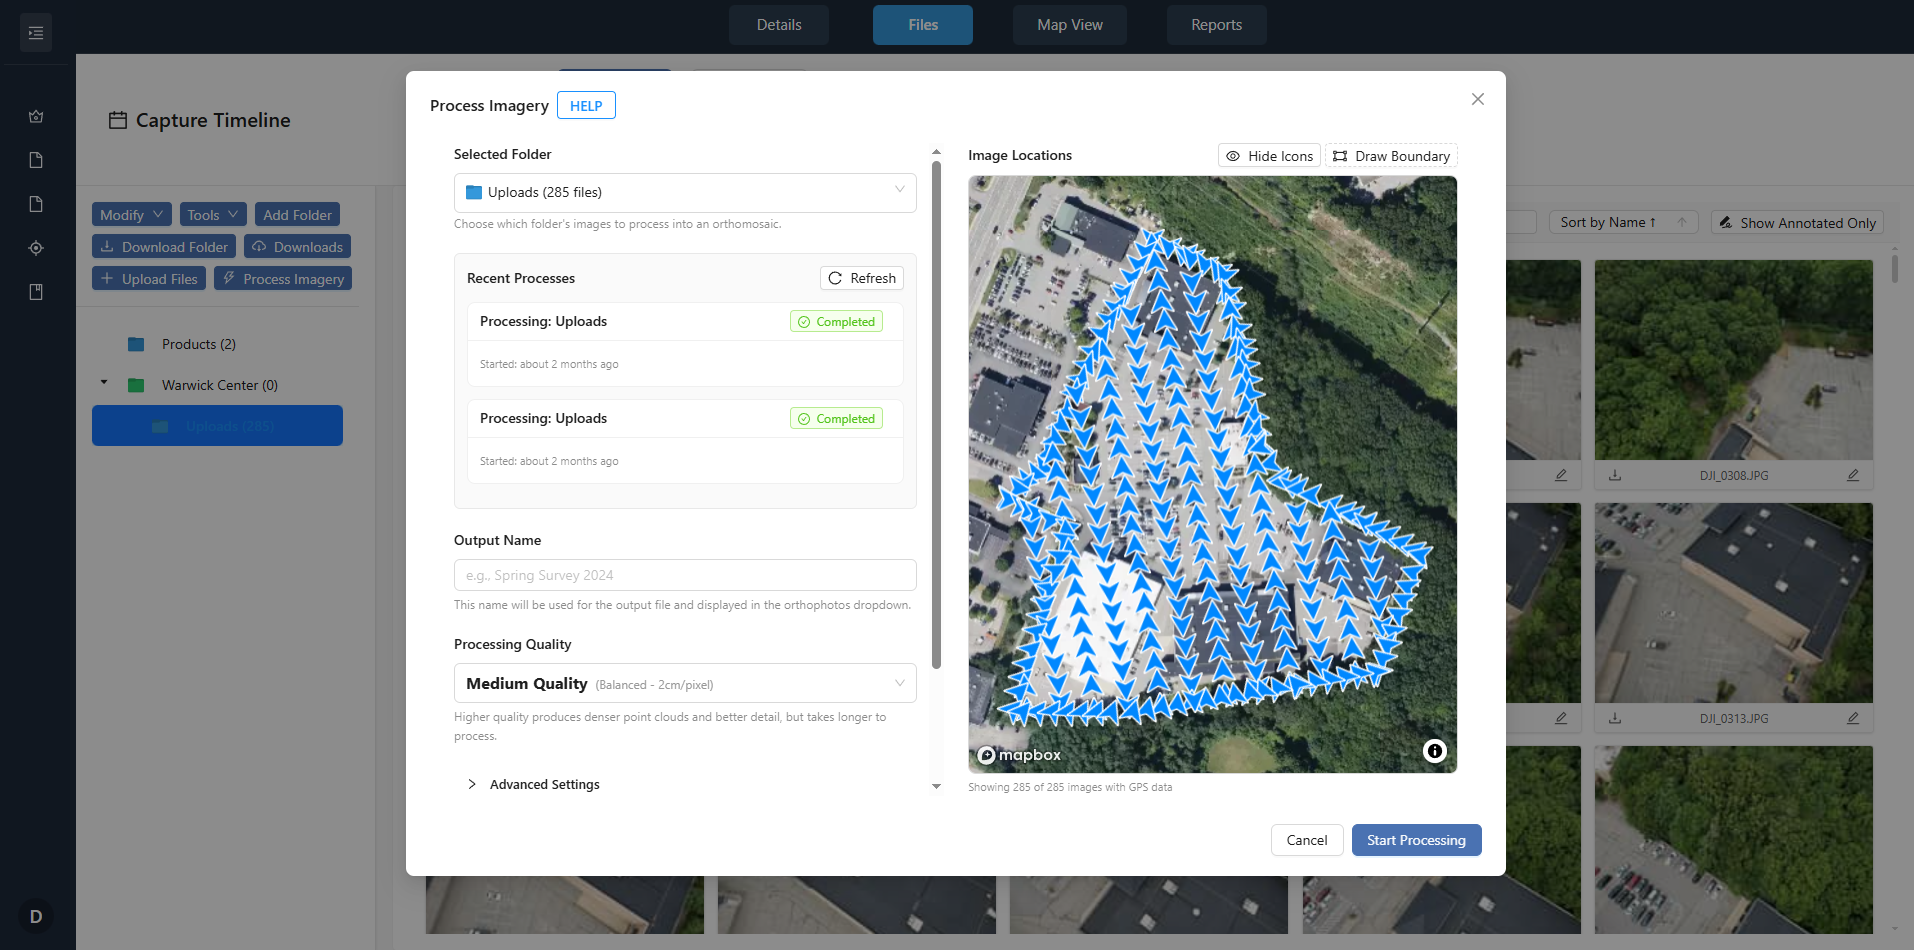
A typical workflow starts with planning the flight path. For a construction site, the drone operator sets waypoints that cover the entire area at a consistent altitude. The same flight plan is used each time, so the resulting orthomosaics align precisely. After each flight, the images are uploaded to a platform that processes them into a georeferenced orthomosaic and a 3D model if needed. The platform then allows the project team to view the new data alongside previous captures and the design model.
A service like nationaldroneservices.net provides exactly this kind of data processing and delivery. The platform organizes aerial imagery and mapping outputs so that project teams can access them through client portals. This removes the need for each team member to handle raw drone files or learn photogrammetry software. Instead, they log in, view the latest site capture, and compare it with earlier ones.
Once the data is in the platform, the team can perform change detection, add annotations, and share specific views with stakeholders. The result is a single source of truth for site status that everyone from the project owner to the site superintendent can rely on.
What to watch out for when comparing captures
Site capture comparison is not foolproof. A few practical cautions keep the analysis accurate:
- Lighting differences between flights can make the same area look different. Compare images taken at similar times of day when possible.
- Vegetation growth can hide ground features. Schedule flights after clearing or mowing if vegetation is a concern.
- Shadows from tall structures shift during the day. Plan flight times to minimize shadow cover over critical work areas.
- Equipment and vehicles move. A crane that appears in one capture and not another is not necessarily a problem; check if it was scheduled to move.
- Coordinate system alignment matters. Ensure that every orthomosaic uses the same coordinate reference system so that overlays line up correctly.
By keeping these factors in mind, a project team can avoid false positives and make confident decisions based on the aerial data.
Making the case for regular drone capture
For project teams that have not yet adopted drone-based progress monitoring, the main objection is often the perceived cost or complexity. In practice, the investment in regular site capture pays for itself the first time it catches a delay that would have gone unnoticed for weeks. The cost of rework or schedule overrun on a single issue can exceed the entire cost of a season of drone flights.
Moreover, the data set builds value over time. A complete archive of orthomosaics from every flight date becomes a record of exactly how the project was built. That record is useful for warranty claims, forensic analysis if something fails, and even marketing materials after the project is complete. The platform at nationaldroneservices.net makes it easy to store, organize, and retrieve this historical data through its client portals.
Getting started with your first comparison
If you are new to using drone visuals for project monitoring, start small. Pick one active site and schedule a baseline flight. Process the data into an orthomosaic and a simple 3D model. Then schedule a second flight two weeks later and compare the two sets. Look for obvious differences: new structures, changes in grade, movement of materials. Once you see how much information a single comparison reveals, you will likely want to expand the practice to other sites.
The key is consistency. Stick to a regular flight schedule, use the same flight plan, and store all data in a platform that supports side-by-side viewing and annotation. Over time, the site capture comparison becomes a routine that keeps the project team informed and responsive.